Chrome DevTools for beginners, the 20% you use daily
Chrome DevTools has about twenty panels and you need four. Here is what each answers, the shortcuts worth learning, and debugging without console.log.
%20by%20%E2%80%9EDiceBear%E2%80%9D%2C%20licensed%20under%20%E2%80%9ECC0%201.0%E2%80%9D%20(https%3A%2F%2Fcreativecommons.org%2Fpublicdomain%2Fzero%2F1.0%2F)%3C%2Fdc%3Arights%3E%3C%2Frdf%3ADescription%3E%3C%2Frdf%3ARDF%3E%3C%2Fmetadata%3E%3Cmask%20id%3D%22viewboxMask%22%3E%3Crect%20width%3D%2216%22%20height%3D%2216%22%20rx%3D%228%22%20ry%3D%228%22%20x%3D%220%22%20y%3D%220%22%20fill%3D%22%23fff%22%20%2F%3E%3C%2Fmask%3E%3Cg%20mask%3D%22url(%23viewboxMask)%22%3E%3Crect%20fill%3D%22%23e4f0ff%22%20width%3D%2216%22%20height%3D%2216%22%20x%3D%220%22%20y%3D%220%22%20%2F%3E%3Cpath%20d%3D%22M4%202h8v1h1v3h1v2h-1v3h-1v1H9v1h4v1h1v2H2v-2h1v-1h4v-1H4v-1H3V8H2V6h1V3h1V2Z%22%20fill%3D%22%23ffdbac%22%2F%3E%3Cpath%20d%3D%22M4%202h8v1h1v3h1v2h-1v3h-1v1H4v-1H3V8H2V6h1V3h1V2Z%22%20fill%3D%22%23fff%22%20fill-opacity%3D%22.1%22%2F%3E%3Cpath%20d%3D%22M13%207h1v2h-1zM2%207h1v2H2z%22%20fill%3D%22%23fafad2%22%2F%3E%3Cpath%20d%3D%22M6%2013H4v3h2v-3ZM12%2013h-2v3h2v-3Z%22%20fill%3D%22%2388d8b0%22%2F%3E%3Cpath%20fill%3D%22%23fff%22%20fill-opacity%3D%22.2%22%20d%3D%22M5%2013h1v3H5zM10%2013h1v3h-1z%22%2F%3E%3Cpath%20d%3D%22M10%205h1v2H9V6h1V5ZM5%205h1v2H4V6h1V5Z%22%20fill%3D%22%23fff%22%2F%3E%3Cpath%20fill%3D%22%23647b90%22%20d%3D%22M11%206h-1v1h1zM6%206H5v1h1z%22%2F%3E%3Cpath%20d%3D%22M6%209v1h3v1h1v-1H9V9H6Z%22%20fill%3D%22%23de0f0d%22%2F%3E%3Cpath%20d%3D%22M4%202h8v1h1v2h1v7h-1v-1h-1V5h-1V4H5v1H4v6H3v1H2V5h1V3h1V2ZM2%2012v1H1v-1h1ZM14%2012h1v1h-1v-1Z%22%20fill%3D%22%23009bbd%22%2F%3E%3C%2Fg%3E%3C%2Fsvg%3E)
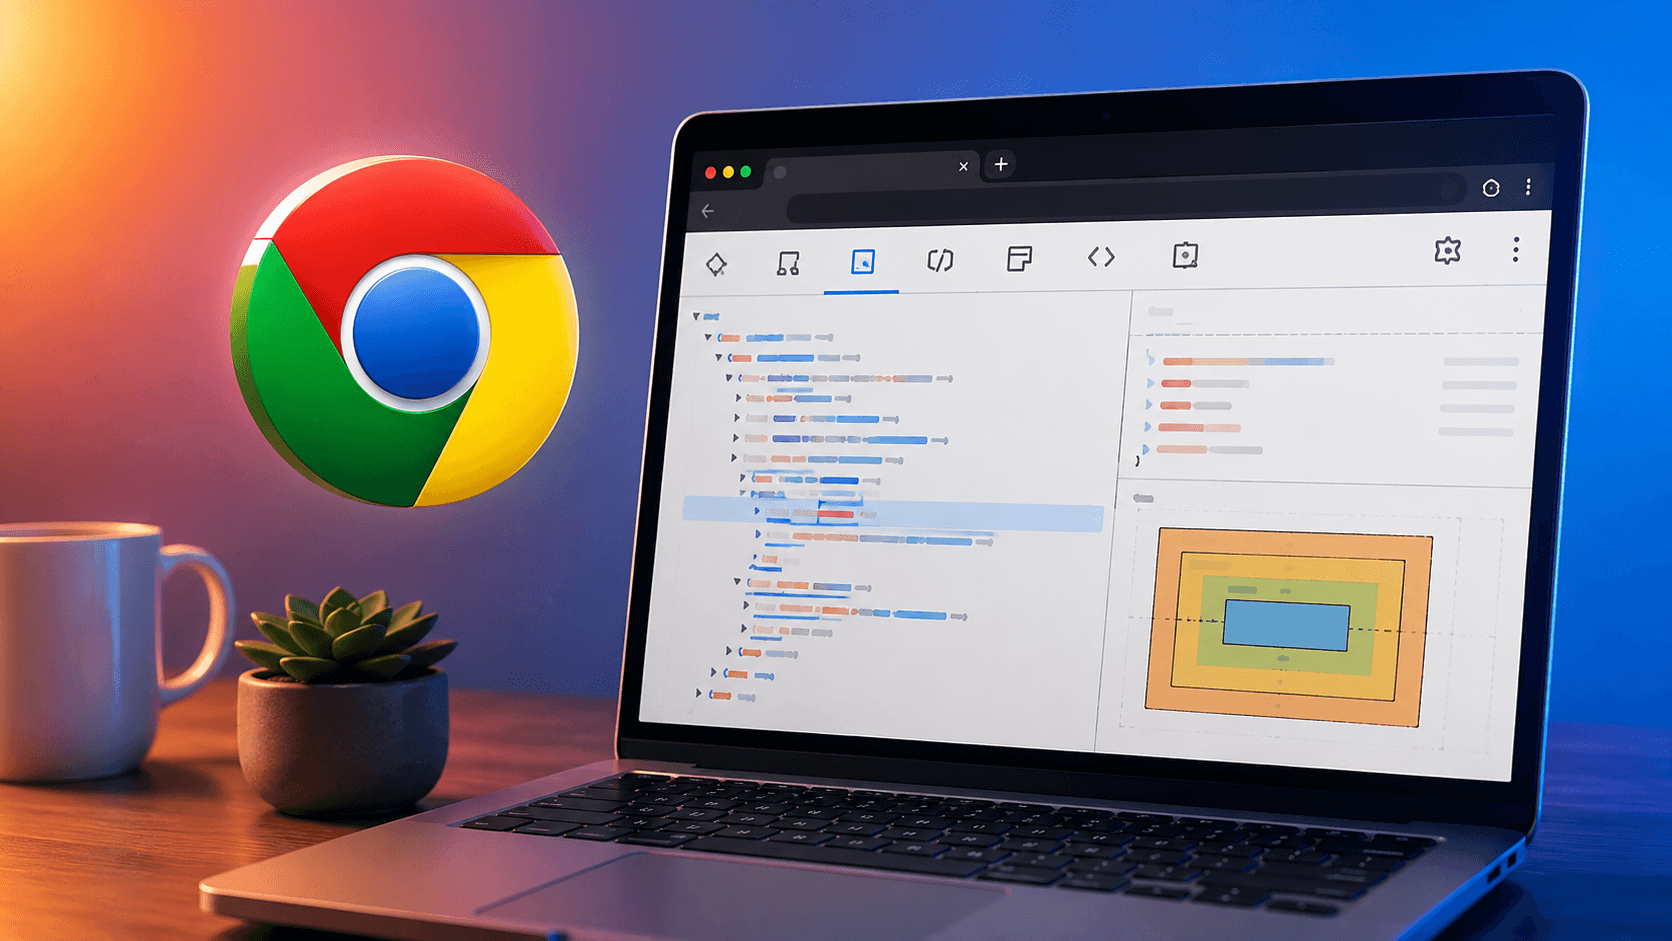
Chrome DevTools is a set of debugging tools built into the browser. Open it with F12 or Ctrl+Shift+I on Windows and Linux, Cmd+Option+I on Mac. Four of its panels cover almost everything you will do:
| Panel | Answers |
|---|---|
| Elements | What HTML and CSS is actually on the page right now? |
| Console | What did my JavaScript log, and what broke? |
| Network | Did that request happen, and what came back? |
| Sources | What is my code doing, line by line? |
Everything else is a specialist tool you will meet when you need it. This post covers those four properly, because knowing them well is the difference between guessing at a bug and reading the answer off the screen.
The same tools ship in Edge, Brave, Opera and every other Chromium browser. Firefox and Safari have close equivalents with different names.
Three shortcuts worth muscle memory
| Action | Windows / Linux | Mac |
|---|---|---|
| Open DevTools | F12 or Ctrl+Shift+I |
Cmd+Option+I |
| Open Console directly | Ctrl+Shift+J |
Cmd+Option+J |
| Inspect an element | Ctrl+Shift+C |
Cmd+Shift+C |
| Command Menu | Ctrl+Shift+P |
Cmd+Shift+P |
The last one deserves special attention. Ctrl+Shift+P opens a searchable list of every DevTools command, the same idea as a command palette in an editor. Type "screenshot" to capture a full-page image, "coverage" to find unused CSS, "sensors" to fake a location. You do not have to know where a feature lives, only roughly what it is called.
Elements: what is actually on the page
Right-click anything on a page and choose Inspect. DevTools opens with that element selected in the Elements panel.
The important idea: this is not your source file. It is the live DOM, after the browser parsed your HTML, after JavaScript modified it, after React rendered. When your source says one thing and the page shows another, this panel is what tells you which one you are looking at.
The Styles pane is where CSS bugs die
With an element selected, the right-hand Styles pane lists every rule matching it, in order, most specific at the top. Three things it gives you for free:
Overridden rules appear with a line through them. Your color: red crossed out means something else won. Scroll up to see what.
You can edit anything, live. Click a value and type. Click the checkbox to toggle a property off. Nothing is saved, so a reload resets everything, which makes it the safest place to experiment. Most CSS gets figured out here first and copied into the file afterwards.
The Computed tab shows the final answer. Instead of reading a cascade, it shows the one value that won for every property, and expanding one tells you which rule set it. When "my style is not applying", Computed tells you what did apply instead.
The box model diagram
At the bottom of the Computed tab is a diagram of content, padding, border and margin with real numbers in it. Hovering each region highlights it on the page in colour.
This is the fastest way to answer "why is there a gap there". The gap is padding on one element or margin on another, and the diagram tells you which in about two seconds.
Two more Elements habits
:hovtoggles states. Force:hover,:focusand:activeon and style them without contorting your mouse. Debugging a dropdown that closes when you move away is otherwise miserable.- The layout badges. Elements using flexbox or grid get a small
flexorgridbadge. Click it and the browser draws the lines, gaps and tracks over the real page. For grid especially this turns an invisible system into something you can see.
Console: more than console.log
The Console does two jobs: it shows messages and errors, and it is a live JavaScript prompt running in the page's context.
Read errors properly. A red error has a file and line number on the right. Click it and you land on that line in Sources. The stack trace below expands to show what called what. Most beginners read the first line and guess; the whole answer is usually two clicks away.
Run code against the live page. Type any JavaScript and it executes with access to everything the page has:
document.querySelectorAll(".card").length; // how many cards are actually rendered?
getComputedStyle($0).display; // what display does the selected element have?
$0 is a built-in referring to the element currently selected in Elements. $1 is the one before it. Combined with Inspect, this is the fastest way to check a real value on a real element.
Log methods that beat console.log:
| Method | Use |
|---|---|
console.table(arrayOfObjects) |
Renders a sortable table. Transforms debugging API responses. |
console.error() / console.warn() |
Red and yellow, with a stack trace |
console.time() / console.timeEnd() |
Measures elapsed time between the two |
console.count() |
Counts how many times a line ran, useful for re-render loops |
console.dir(el) |
Shows a DOM node as an object instead of as HTML |
console.assert(cond, msg) |
Logs only when the condition is false |
console.table is the one to adopt today. An array of objects that is unreadable as a log becomes a spreadsheet.
Network: what your code actually sent
Open the Network panel, then reload the page while it is open. It only records while it is watching, which is the most common reason it looks empty.
Every request appears as a row with its status, type, size and timing. For debugging a failing API call, three columns matter.
Status. 200 succeeded. 404 means the URL is wrong. 401 or 403 mean authentication or permission. 500 means the server broke and the problem is not in your frontend. A row showing (failed) or (blocked) usually means CORS or an ad blocker.
The Headers tab on a selected request shows exactly what was sent, including the request method, the full URL with query string, and every header. This is where you confirm your token actually got attached, rather than assuming it did.
The Response tab shows the raw body that came back. Not what you think came back, what did. Half of all "the API is broken" reports are resolved here by discovering the API returned exactly what it should and the frontend read the wrong property.
Two controls worth knowing: the filter box (type fetch or XHR to hide images and stylesheets) and the throttling dropdown (simulate a slow 3G connection, which is how you find the loading state you never built).
Sources: breakpoints instead of console.log
This is the panel beginners avoid, and the one that most changes how you debug.
A console.log asks the code one question you thought of in advance. A breakpoint pauses everything and lets you ask any question, in any order, with the program frozen.
Set one: open Sources, find your file in the left tree, click a line number. It turns blue. Reload or trigger the code, and the page freezes at that line.
While paused, you have:
- Scope, listing every variable in scope right now with its actual value. No logging required.
- Call Stack, showing the chain of functions that led here. This answers "how did we even get to this line", which logs cannot.
- Watch, for expressions you want evaluated continuously.
- The Console, which now runs inside the paused function's scope. Type a local variable name and read its value.
The step controls run along the top: resume, step over the next line, step into a function call, step out of the current one. Step over is the one you will use most.
Conditional breakpoints are the trick worth learning early. Right-click a line number, choose "Add conditional breakpoint", and enter something like user.id === 42. The code runs at full speed until that condition is true. Debugging one bad record out of a thousand-row loop goes from impossible to trivial.
The rest, briefly
Worth knowing exist, not worth studying yet.
- Application shows what the site stored:
localStorage, cookies, session storage. Clear a stuck value here rather than writing code to do it. - Lighthouse runs an automated audit for performance, accessibility, SEO and best practices, and produces a scored report with specific fixes. A good habit before shipping anything.
- Performance records what happened during a few seconds of interaction. Powerful and genuinely hard to read; save it for real jank.
- Device toolbar (
Ctrl+Shift+M) simulates phone and tablet viewports. It is a good check of your breakpoints and a poor substitute for a real device. - Rendering has a set of visual debugging switches, including paint flashing and an emulator for
prefers-color-scheme, which is the quickest way to check dark mode.
Four bugs and where to look
| Symptom | Panel | What to check |
|---|---|---|
| My CSS is not applying | Elements → Computed | What value actually won, and which rule set it |
| The button does nothing | Console, then Sources | An error on click; then a breakpoint in the handler |
| The data is not showing | Network → Response | What the server actually returned |
| The page is blank | Console | The first error, not the last one |
That last row is a real habit worth forming. When several errors appear, the first one usually caused the rest. Fix it and the others often vanish.
The mindset shift
The reason DevTools matters more than it looks is that it turns debugging from guessing into reading. Before it, "why is this element in the wrong place" is a hypothesis you test by editing files and reloading. With it, you select the element, read the computed value, look at the box model, and know.
You do not need to learn twenty panels. Learn Inspect, learn to read the Styles pane, learn to click through an error to its line, and learn to set one breakpoint. That is a week of noticing, and it permanently changes how fast you find things.
JavaScript and the DOM works through selecting, changing and debugging real elements in the browser, which is exactly what the Elements and Console panels are for.
Related reading: CSS Flexbox, where the layout badges in Elements make the axes visible, Async Await Explained for reading the Network panel's timings correctly, and Git Merge vs Rebase for the other tool you will use every day without being taught.
More from the blog
git cherry-pick: move one commit anywhere
Cherry-pick copies a commit onto your current branch. It creates a new commit with a new hash, so the original stays where it was.
Read more
CORS error: what the browser is actually blocking
A CORS error is the browser refusing a response the server already returned with a 200. Here is that proved with two real origins, and the fixes.
Read moreReady to write some code?
Put this into practice - start your first free lesson. No setup, no credit card.